Hello!
We at SQLServerGeeks.com are committed to spread the knowledge as we gain in the process of evaluating the newly released SQL Server 2012 CTP 3 release code named “Denali”.
In this post, let’s create couple of Roles using the Role Manager
If you wish to see any feature like how to create a tabular structure and additional details, I suggest you follow this link here and also here.
This should help you kick start on Tabular Models.
Again, I am using the AdventureWorksDWDenali as my database to create tabular models.
Once you have your tabular model created, you would like to embed security features to the model so as to restrict what the end users should see and what they should not see.
To implement this feature, the developer can create Roles and add definition to each role that justifies its existence.
Here we shall create two roles, add different definition and later plan to analyze the data on Excel.
- Click on Model menu and now click on Roles
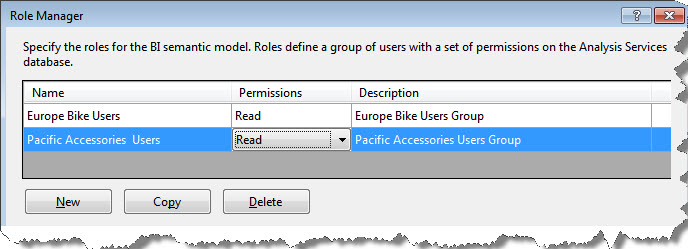
- This will present you with Roles Manager. Using this console the user can add new roles and add definitions also any existing roles can be edited and deleted.
Case 1: Create a Role for only European Bike Users
In the Role Manager console, I have specified name as Europe Bike Users, the role will support only read permission. Similarly, Pacific Accessories Users with read only permission.
Now we shall add definition to the role created. This is done by browsing to the Row Filters
We require two actions or two filters. Namely, filter on country and filter on product category to have the desired output.
Navigate to DimSalesTerritory and in the DAX Filter section add a DAX statement
= DimSalesTerritory[SalesTerritoryKey] = 7 ||
   DimSalesTerritory[SalesTerritoryKey] = 8 ||
   DimSalesTerritory[SalesTerritoryKey] = 10
Where 7, 8 and 10 are territory keys for European Nations.
Navigate to DimProduct and in the DAX Filter section add a DAX statement
= RELATED (DimProductSubcategory[ProductCategoryKey]) = 1 ||
   RELATED(DimProductSubcategory[ProductCategoryKey]) = 3
Where 1 and 3 are category keys for Bikes and Clothing
Here, you must note that I have used the RELATED DAX function, because there is no direct relation between the tables DimProduct and DimProductCategory.
Now click OK.
Now the usual chore, Build and Deploy the solution
Once the task is complete, click on Model and now click on Analyze in Excel option
(I am using the credentials of the current windows user. Role as Europe Bike Users. No Perspective.)
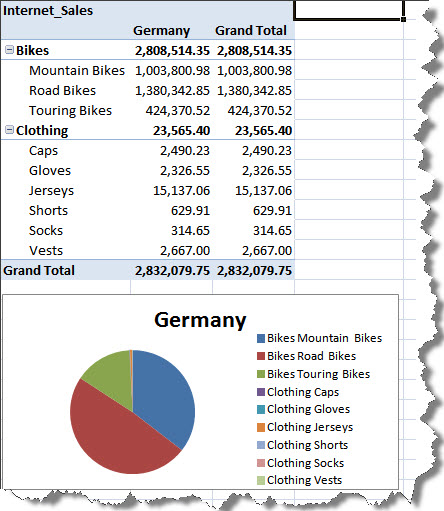
Let us now create a pivot report analysis and a pivot chart for data visualization
Now drag the necessary columns and the data is ready for presentation. Here I have Product Category and Sub Category on rows and Country Name on columns and I have filtered data for Germany only.
In the next post we shall see how to create such charts and pivot tables directly from MS-Excel interface.
That’s all. Happy Learning!
Regards
Raunak Jhawar
Like us on FaceBook | Follow us on Twitter | Join the fastest growing SQL Server group on FaceBook
Follow me on Twitter | Follow me on FaceBook