Hi friends, today we will discuss about new performance monitoring system Extended Events which gets introduced in version SQL Server 2012.In previous versions we were using SQL Trace for capturing events and SQL Profiler for managing and creating SQL trace. SQL Server profile, SQL Trace deprecated in future version of SQL version so you guys start using Extended events in near future which is more lightweight.
In this blog we will create an extended event session following below steps:
- Open SSMS and connect to your SQL Server instance.
- Select database name from available database list. I have selected TSQL2012 database.
- Write following query in query window :
SELECT PP.productid, PP.productname, PC.categoryname
FROM Production.Products PP
INNER JOIN Production.Categories PC ON PP.categoryid = PC.categoryid
- In SSMS, expand Management folder Right click on the session folder and Select New Session Wizard.
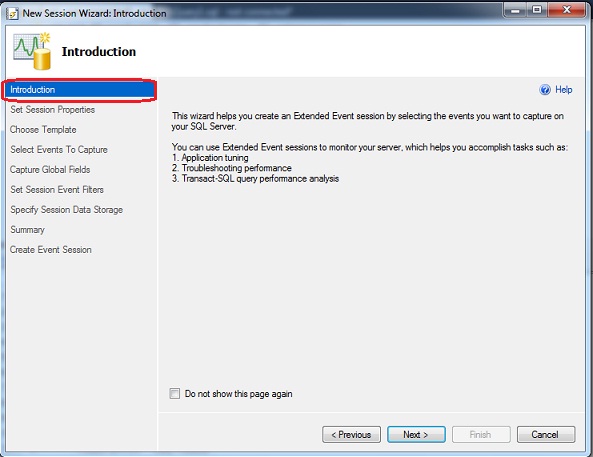
 5. On Introduction page, read the information and click Next.
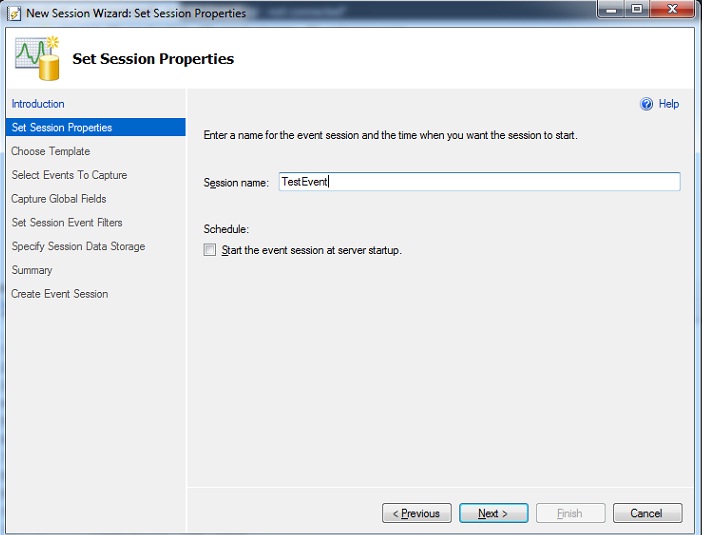
6. On Set Session Properties page, name the session ‘TestEvent’. Click Next.
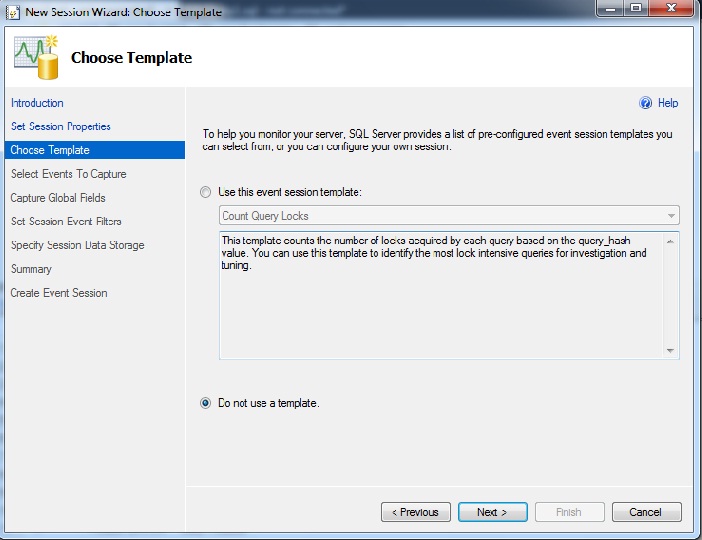
7. On Choose Template page, Select Do Not Use a Template and click Next.
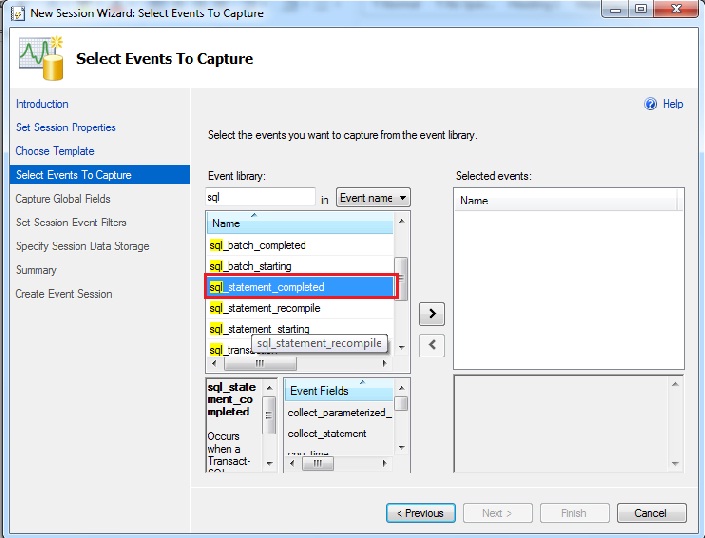
8. On Select Events To Capture page, type string sql in Event Library textbox and select sql_statement_completed. Move it to Selected events box and click Next.
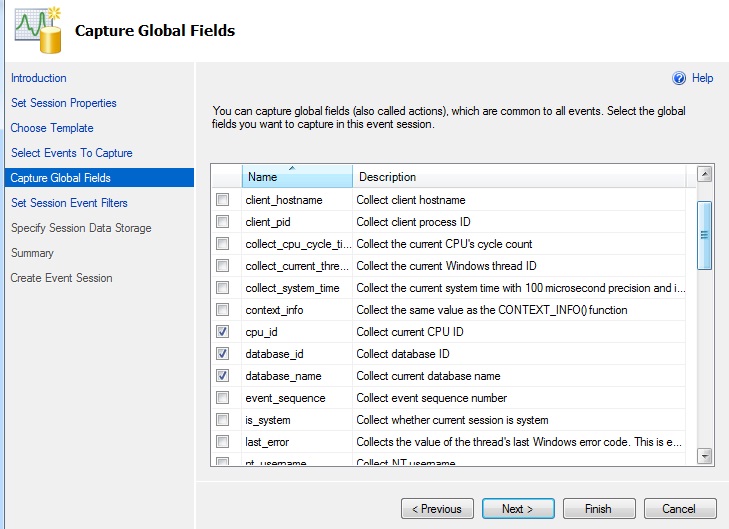
9. On Capture Global Field page, select the fields which you want to capture in this session. Click Next. I have selected few fields like CPU_id, database_id, database_name.
10. On Set Session Event Filter page, create a filter to limit the data you want to capture. I have created filter for database name and sql text. In Field tab select value sqlserver.database_name and Value to be equal to ‘TSQL2012’ with operator value ‘=’. Also, create another filter with Field value sqlserver.sql_text and Value equals to ‘SELECT PP.Productid%’ with operator value ‘like_i_sql_unicode_string’. Click Next.

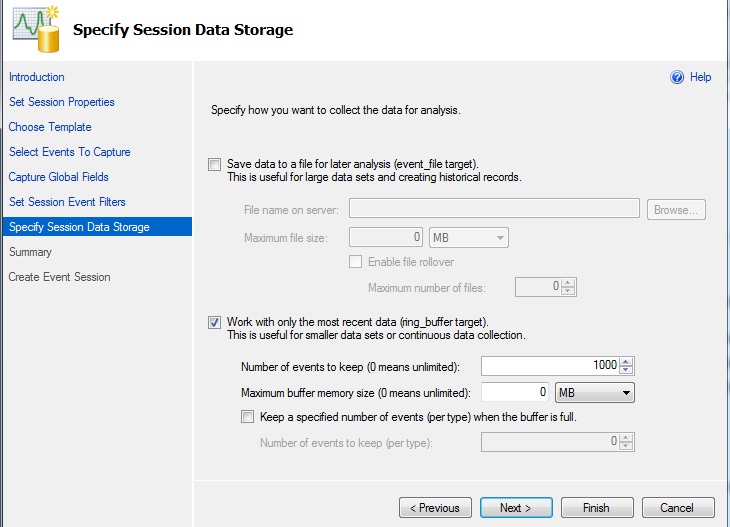
11. On Specify Session Data Storage page specify the way you want to collect the data for analysis.Select option Work with only the most recent data (ring_buffer_target) and click Next.
12. On Summary page, verify your selections that you made for this event session. Click Finish.

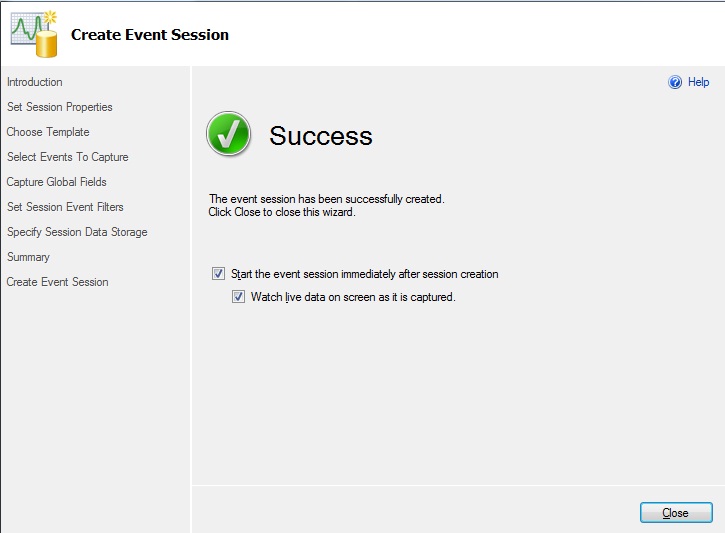
13. On last page of Create Event Session page, select both checkboxes: Start the event session immediately after session creation and Watch live data on screen as it is captured. Click Close.
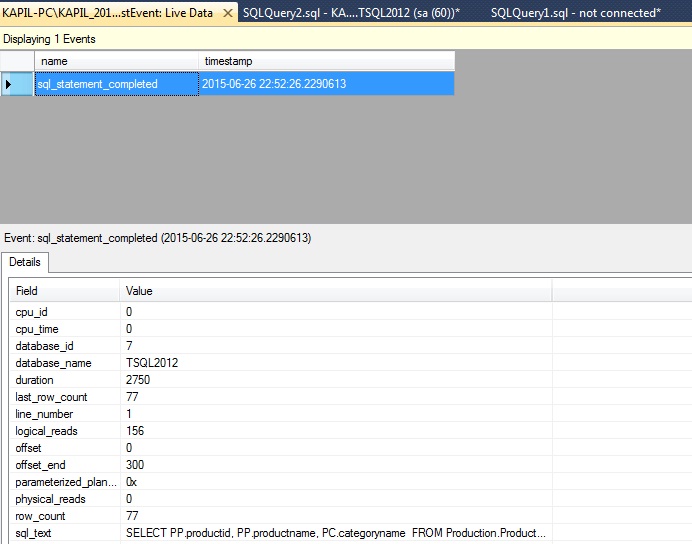
14. Extended Events Live Window gets opened in new window.
15. You can check the new event session in the session folder. Right click on the newly created session ‘TestEvent’.
16. Execute the above query in query window and see event information in Live Data Window.
Extended Events is a more lightweight monitoring system in comparison to SQL Trace. So friends start making use of extended events as SQL Trace will get deprecated in future versions.
That’s all folks for the day. Hope you like this post.