Hello Geeks and welcome to the Day 35 of the long series of One DMV a day. In this series of blogs I will be exploring and explaining the most useful DMVs in SQL Server. As we go ahead in this series we will also talk about the usage, linking between DMVs and some scenarios where these DMVs will be helpful while you are using SQL Server. For the complete list in the series please click here.
Today I am going to talk about how you can collect execution statistics of a particular procedure. Sys.dm_exec_procedure_stats is a DMV which is very useful to track trends of execution for procedures. As the name suggests it is a stats DMV. We have observed in my past blogs that most of these stats DMVs are cumulative. So to make sense out of the data in these DMVs we need to see the trend.
We should collect data from sys.dm_exec_procedure_stats at regular intervals to see how a procedure is executing. This helps in correlating to the problems on the server/database. Let me use this DMV to see how a procedure is behaving and collect its stats.
To make the collection of data from sys.dm_exec_procedure_stats I will be dumping the data first. Then I will update the object name off the collection part. This way I would make this more efficient. One common mistake with the stats collection is not having the object name saved. When an object is dropped and recreated the object ID changes. The previous ID from the stats is no longer valid. You cannot compare the performance before and after you fix anything in the procedure code. So saving the object name is always preferable.
As a first step let’s create the collection table.
CREATE TABLE procedureExecStats_tbl
	(dbId INT
	,objId BIGINT
	,objName NVARCHAR(400)
	,Exec_Cnt BIGINT
	,Exec_Time BIGINT
	,Disk_Reads BIGINT
	,Mem_Reads BIGINT
	,Total_Writes BIGINT
	,Total_Time BIGINT
	,SampledOn DATETIME)
GO

CREATE NONCLUSTERED INDEX IX_procedureExecStats_SampledOn ON procedureExecStats_tbl(SampledOn)
GO
CREATE NONCLUSTERED INDEX IX_procedureExecStats_objName ON procedureExecStats_tbl(objName)
GO
Now create a procedure to collect the stats at a predefined frequency and run it through a scheduled job.
CREATE PROCEDURE usp_collectExecProcStats_prc
AS
BEGIN
	INSERT INTO procedureExecStats_tbl
		(dbId
		,objId
		,Exec_Cnt
		,Exec_Time
		,Disk_Reads
		,Mem_Reads
		,Total_Writes
		,Total_Time
		,SampledOn)
	SELECT database_id,
		object_id,
		execution_count AS Exec_Cnt,
		total_worker_time AS Exec_Time,
		total_physical_reads AS Disk_Reads,
		total_logical_reads AS Mem_Reads,
		total_logical_writes AS Total_Writes,
		total_elapsed_time AS Total_Time,
		GETDATE()
	FROM sys.dm_exec_procedure_stats
	WHERE database_id NOT IN (1,2,3,4,32767)
	AND type = 'P'

	UPDATE procedureExecStats_tbl
		SET objName = OBJECT_NAME(objId, dbId)
	WHERE objName IS NULL
END
GO
I have a procedure named usp_getPubLogger_prc which I will execute in below sequence to collect data from sys.dm_exec_procedure_stats. This is just a simple procedure to select all records from a table.
EXEC usp_collectExecProcStats_prc
GO
EXEC usp_getPubLogger_prc
GO
EXEC usp_collectExecProcStats_prc
GO
EXEC usp_getPubLogger_prc
GO
EXEC usp_collectExecProcStats_prc
GO
DBCC DROPCLEANBUFFERS()
GO
EXEC usp_getPubLogger_prc
GO
EXEC usp_collectExecProcStats_prc
GO
Now I have my data collection on procedure stats from sys.dm_exec_procedure_stats. Let me run the below query to see how my procedure executed in between each collection.
;WITH c AS
(
	SELECT ROW_NUMBER() OVER(ORDER BY sampledOn) As RowNum,
		objName,
		Exec_Cnt,
		Exec_Time,
		Disk_Reads,
		Mem_Reads,
		Total_Writes,
		Total_Time,
		SampledOn
	FROM procedureExecStats_tbl
	WHERE objName = 'usp_getPubLogger_prc'
)
SELECT c1.objName,
	c1.Exec_Cnt - c2.Exec_Cnt AS Execs,
	(c1.Exec_Time - c2.Exec_Time)/(c1.Exec_Cnt - c2.Exec_Cnt) AS Avg_Exec_Time,
	(c1.Total_Time - c2.Total_Time)/(c1.Exec_Cnt - c2.Exec_Cnt) AS Avg_Total_Time,
	c1.Disk_Reads - c2.Disk_Reads AS Physical_Reads,
	c1.Mem_Reads - c2.Mem_Reads AS Logical_Reads,
	c1.Total_Writes - c2.Total_Writes AS Total_Writes,
	c1.SampledOn
FROM c c1
INNER JOIN c c2
ON c1.RowNum = c2.RowNum + 1
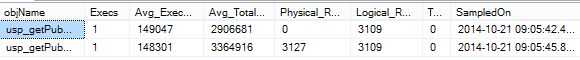
From the above out put you can observe the physical reads increased in my execution between 42nd and 45th second. So I can say something has cleared my table data from the buffer pool. You can track such trends and see for any pattern in a procedure behavior using sys.dm_exec_procedure_stats.
Tomorrow I will be covering another execution related DMV. So, stay tuned. Till then
Happy Learning,
Manu
Like us on FaceBook | Join the fastest growing SQL Server group on FaceBook |
Follow me on Twitter | Follow me on FaceBook