Hi Friends,
Sometime back I blogged about a frustrating experience of a SQL Server DBA with Performance Monitor. Though, it was such a simple thing but still not known to many. You can read that blog here;
Today, I want to talk about another technique in Windows Performance Monitor that can alleviate some of your frustration.
Would you not like to open Performance Monitor with your set of default counters? Or wouldn’t it be nice that you have four or five different shortcuts to Performance Monitor and each shortcut opens up with a different set of default counters. For example, you could create one shortcut that opens up PerfMon with all counters related to IO, another shortcut that opens up PerfMon related to Memory, etc. If you don’t know this technique, you are not being productive, for sure.
So here is how you do it.
Start -> Run -> PerfMon
Performance Monitor opens up. Click on Performance Monitor on the left pane. Select/Add your counters. For my example here, I add some disks related counters.
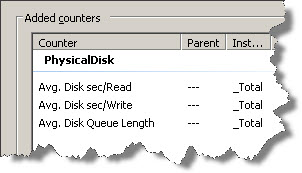
Click on OK.
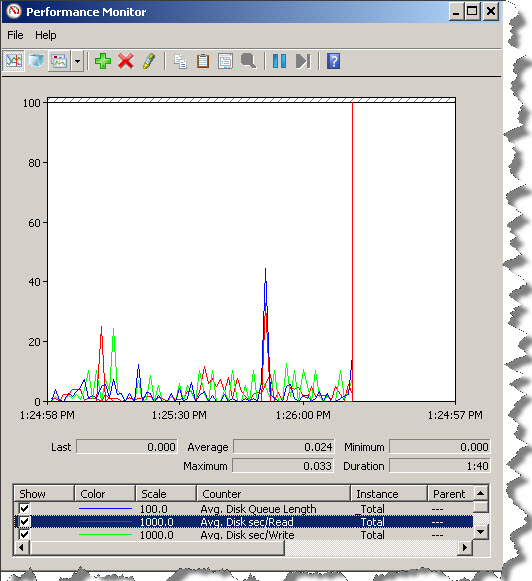
Now you can see the counters that you selected and the real-time graph. Well this is something that you all know. The trick starts now.
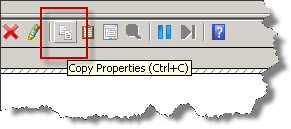
From the toolbar, click on Copy Properties.
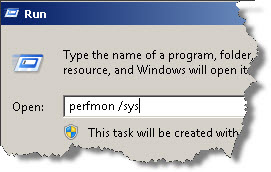
Start another instance of Performance Monitor, but this time use /sys switch. See below:
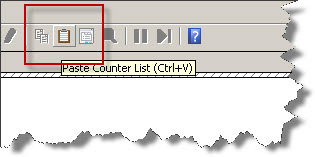
This will open up only the PerfMon console. Click on Paste on the toolbar, this will paste the counters list copied from the previous instance to this instance.
Is it working? Should be 🙂 – see below.
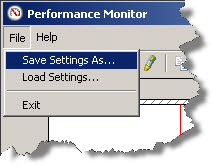
You can now save these settings as a shortcut. Click on File -> Save Settings As… provide an appropriate name to the file and save this on the desktop. I simply named it Disk – and it makes sense to put it on desktop. Remember, you are doing this on your production box and the purpose is that if there is a troubleshooting scenario, you simply log on to the box and double click the shortcut and perfmon opens up with the counters.
Once saved, close all perfmon windows including the one that you just saved. Navigate to dektop (Windows key + D), double click the shortcut to test. The perfmon console should open up with your counters.
Working? Should be !
This way, you can have multiple shortcuts, well categorized as per you need. Mind it, do not create too many shortcuts – the purpose gets defeated !
Nice & Helpful in daily DBA life.