Hi friends, today we will learn another new feature Live Query Statistics which gets introduced in SQL Server 2016.
It’s a common scenario in our day-to-day life that queries takes longer time to execute and we are waiting for its completion so that we can check the actual execution plan to check the operators to improve the performance. So friends this is overcome now in SQL Server 2016.
In SQL Server 2016 we get the new facility to view the live execution plan of a current executing query and can check which steps are currently being performed. This feature is very helpful in debugging issues related to performance displaying overall query progress and run-time statistics for query plan operators.
How to get it enabled?
There are two ways to get this feature enabled:
First, by clicking on icon of Live Query Statistics as shown in figure.

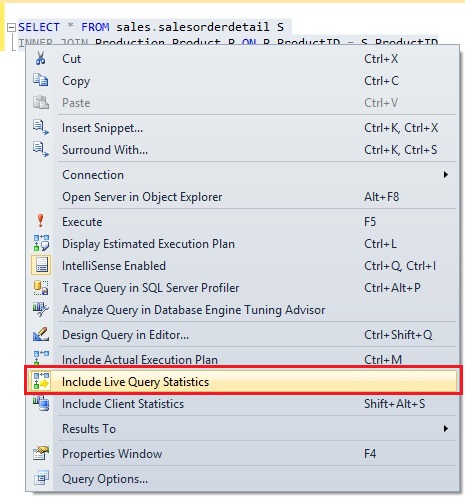
Another one, is selecting the query and then Right click on it to select option Include Live Query Statistics. No shortcut key is currently assigned to enable Live Query Statistics option.

Now, I will execute a query to see the live execution plan.
SELECT * FROM sales.salesorderdetails S

INNER JOIN Production.Product P ON P.ProductId = S.ProductId

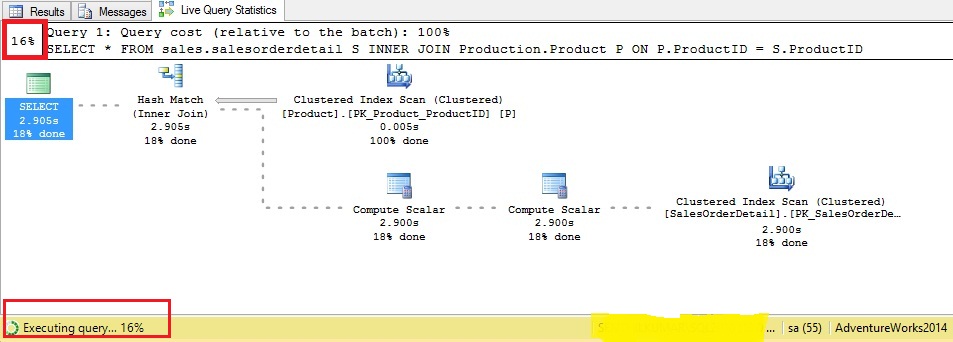
Here, I can view in my live execution plan that query plan operators are currently in progress and continuously changing values until execution of query gets completed.
That’s all folks for the day!!
Regards,
Kapil Singh Kumawat
Like us on FaceBook | Join the fastest growing SQL Server group on FaceBook
