
As the move to Azure getting popular for SQL Server, the adoption involves a step to understand the costs associated with the migration – The measure of an Azure DTU. Yes, the most under-explained term of the Azure world. Azure DTU is the term, heard so often and yet, unless shown on your bill, very hard to estimate close to accuracy. Andy Mallon (b|t) has recently done a detailed effort in breaking this into bits to explain What the heck is a DTU.
The Azure DTU Calculator
To understand the Azure DTU in a better sense, let us start with how you should measure the utilization of resources. The DTU Calculator provides an estimated service tier which will suit for your workload. The input for the Azure DTU calculator is the four performance counters collected using either an exe or powershell script provided on the site. The four counters collected are
- Processor – % Processor Time
- Logical Disk – Disk Reads/Sec
- Logical Disk – Disk Writes/Sec
- Database – Log Bytes Flushed/Sec
You upload the values collected for these counters when running your workload. In few seconds you know which tier suits best for your workload.
As simple as it sounds, these measures are going to give you an estimate for a single database on a single instance where no other process is consuming the CPU and IOPS (I/O operations per second) except your sqlservr.exe. This is far too optimal for many of the real-world scenarios.
Ok Genius – What next?
So, to get a complete picture for individual databases, you need to provide the CPU utilization, IO and log bytes’ flushes for each individual database.
CPU
Calculating the CPU for individual databases is far from accurate with current DMVs and any performance counters. The query from Glenn Berry’s Diagnostics Information Queries gives the CPU utilization for each database. These CPU utilization values are cumulative. So, you need to get the average for the time interval between two samples of the data. You will still miss any usage of CPU between samples if a query is removed from the cache. But this is the closest estimate of average between intervals.
WITH DB_CPU_Stats
AS
(SELECT DatabaseID, DB_Name(DatabaseID) AS [Database Name], SUM(total_worker_time) AS [CPU_Time_Ms]
 FROM sys.dm_exec_query_stats AS qs
 CROSS APPLY (SELECT CONVERT(int, value) AS [DatabaseID]
              FROM sys.dm_exec_plan_attributes(qs.plan_handle)
              WHERE attribute = N'dbid') AS F_DB
 GROUP BY DatabaseID)
SELECT ROW_NUMBER() OVER(ORDER BY [CPU_Time_Ms] DESC) AS [CPU Rank],
       [Database Name], [CPU_Time_Ms] AS [CPU Time (ms)],
       CAST([CPU_Time_Ms] * 1.0 / SUM([CPU_Time_Ms]) OVER() * 100.0 AS DECIMAL(5, 2)) AS [CPU Percent]
FROM DB_CPU_Stats
WHERE DatabaseID <> 32767 -- ResourceDB
ORDER BY [CPU Rank] OPTION (RECOMPILE);
For example, if you want to collect the sample every 5 sec and consider the CPU for 1 sec, divide the difference between the samples by 5 to get the average for 1 sec.
Ok, to make things more complicated, This CPU usage is the % of total usage by the SQL instance. For example, your SQL instance is using 10% of total CPU on the server. One of your user database is using 70% CPU. This means, your database is using 7% of the total CPU.
Now, how do you measure the CPU usage for your SQL Server? The following performance counter is your point to start.
Process(sqlservr) – % Processor Time
But wait, this is just your starting point. The counter is not the % CPU for your SQL Server process. It is the sum of % of cpu on each core. This means the average CPU usage of your SQL Server across all CPU cores can be calculated as follows.
SQL Server CPU Usage = (Process(sqlsevr) – % Processor Time) / (Number of cores)
So, an 800 value of this counter on a 16-core server means, your SQL server is using 800 / 16 = 50%.
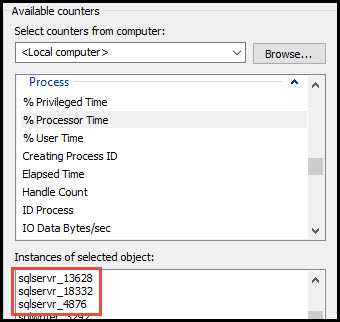
Fine, but I see the counter for sqlservr, sqlservr#1, sqlservr#2, etc. which one should I check? Running multiple instances on single server or a failover cluster – yes, another very common scenario.
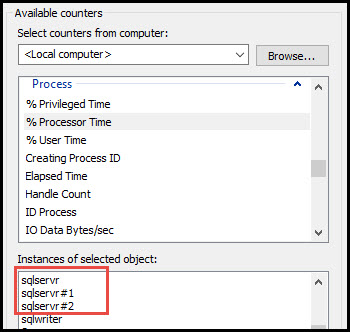
You can still find out which process is related to which instance by doing this small hack in registry, described the KB 281884, to see the instances in performance counter appended with process id.
That will help you know the first metric to feed to the Azure DTU Calculator.
IOPs
IO operations per second is relatively easier to calculate. The DMV sys.dm_io_virtual_file_stats provides the cumulative IO stats for each file in all the databases. The following query gives the cumulative IO stats for all data files (Unless there are multiple log files – you can modify the query accordingly to filter out all log files).
WITH D
AS(
	SELECT
		database_id,
		SUM(num_of_reads) AS IO_Reads,
		SUM(num_of_writes) AS IO_Writes
	FROM sys.dm_io_virtual_file_stats(NULL, NULL)
	GROUP BY database_id)
SELECT
	D.database_id,
	SUM(D.IO_Reads) - SUM(L.num_of_reads) AS Data_Reads,
	SUM(D.IO_Writes) - SUM(L.num_of_writes) AS Data_Writes
FROM D
JOIN sys.dm_io_virtual_file_stats(NULL, 2) L
	ON D.database_id = L.database_id
GROUP BY D.database_id
Given that these IO stats are cumulative, you need to get the average for the time interval between two samples, like CPU.
Log Bytes Flushed Per Second
Log bytes flushed per second is one of the simplest metrics you can collect for the Azure DTU Calculator. The following performance counter has the values for each database.

So, collect the counter values for the database you are interested in.
The Final Feed
Great! You have got all the data you needed to feed to the Azure DTU Calculator. But the quest is still not complete. The biggest challenge is to align all the above data as close as possible.
If you get the CPU usage for 10:01:01 and align it with the IOPs at 10:01:02 and the log flushes at 10:01:03, the results may be skewed. It is recommended to have the frequency aligned for each collection and run them in parallel. Round off the values to the desired interval. Then pull the values into a CSV file in the format required for the Azure DTU Calculator.
| Time | CPU | Reads | Writes | Log Flushes |
| 03/04/2017 10:00:01 |
Are we there yet?
Almost, you have got the feed close to what the Azure DTU Calculator can use. It is not perfect, but it is the closest to the accurate input for the calculator.
Now, how accurate is the Azure DTU usage predictions by the Azure DTU Calculator?
It is very hard to achieve an accuracy on the usage before you migrate and start using the database on Azure. The Azure DTU usage may be completely off from what you may have predicted. But there are other many other factors we are not considering for predicting using Azure DTU Calculator. It is not apples to apples comparison. For example, you never considered the speed of the processors, just the count of cores. Although the documentation says, memory usage is considered for measuring the Azure DTU, the Azure DTU Calculator does not include any memory related counters as input.
Remember the resource allocation in Azure is controlled using resource governor. If you have used resource governor in past, the resources are throttled on the limit set for the resource group. So, your queries will run under those limits. This means when there are multiple queries running on your database, the limited resources are shared between multiple queries.
If you had collected the stats on-premise when there are 10 parallel queries and when you migrate to Azure and start running 50 parallel queries, each of similar weighting, there will be some slowness. For a well-designed application, which is consistent with workload, the predictions will be close to the actual usage on Azure. But in real-world there are very few applications which generate a controlled and predictable workload.
Tier First Approach
The best way to approach choosing the right fit in Azure is start with choosing the right tier. Each tier in Azure has definitive limits on the database level. A Standard Tier for single database and a Standard Tier for elastic database, both have a limit of 100 DTUs per database.

So, if a single database doesn’t give you the expected performance in Standard Tier, there is no way it can give you better performance with Standard Tier in an elastic pool.
In conclusion, choose the tier first based on single database and the use elastic pool to fit in multiple databases into the pool based on how your workload is distributed across the databases over time. I will be writing more about the best ways to analyse the results from the Azure DTU Calculator.
Happy Learning,
Manu
Like us on FaceBook | Join the fastest growing SQL Server group on FaceBook |
Follow me on Twitter | Follow me on FaceBook